Are the Spartan Race elite heats becoming more competitive? While the answer to that question seems to have an obvious and logical answer, there has been no actual analysis of data to prove it, so I put on my academic hat and went to work. Yes, I’m nerdy like that. I should know better than to write something that is half academic paper and half blog post, but I’m doing it anyways. This is a little lengthy, but feel free to skip to the results if you don’t mind missing the thrilling data analysis.
Unlike most other sports, it is nearly impossible to compare results from one obstacle race to the next due to all the confounding variables such as length of course, path of course, numbers of obstacles, new or novel obstacles, order of obstacles, weather conditions, etc. What we are left with is “sensing” that competition is getting stronger as many racers (myself included) have begun to finish further back in the standings. Although it is not without limitations, I developed a methodology to provide at least a perspective on the differences in competition levels from 2012 to 2013.
METHODS
In developing a base point for comparison, I used one constant across the races — Hobie Call as the winner. That provided a consistent surrogate measure for the fastest time through the course, enabling finishing time comparisons to not only the 1st place finisher, but also to a single person. While not perfect, this provided modest controls for differences among winners. The Georgia Sprint, Temecula Super, and Utah Beast were all won by Hobie Call in both 2012 and 2013 and each of these was analyzed independently. Finishing time data for the Saturday elite heats for all 3 races were obtained from the Spartan results pages for 2012 and 2013. The top 20 finishing times were extracted for each race in both years. While the analysis could have extended deeper into the field, I surmised that competition intensity would decline at some point and the assumption was made that everyone finishing in the top 20 was competing at their highest levels. The years of 2012 and 2013 were used because they are the only years containing data for individual races. Note: Not all races had data listing finishing times in order, thereby reducing the races for which comparisons could be made. It should also be noted that the signature Vermont Beast Race was not used because of the significant change in race formats between 2012 and 2013.
For each of the 3 races, the first place finishing time was standardized to a score of 1. The remaining 19 finisher scores times were calculated on the percentage of their finishing times behind the winner. This is best explained by an example; if the winner finished a race in 40 minutes and the 2nd place racer finished in 44 minutes, the 2nd place racer was given a score of 1.1 (= 44/40). In other words, it took him 1.1 times as long to finish as the winner. If the standardized scores in 2013 were lower than the scores in 2012 that would indicate increased competition.
Descriptive statistics were calculated and Kruskal-Wallis tests were run to determine if there were significant differences between 2012 and 2013. Kruskal-Wallis was used because it is a conservative test and I could be confident with any differences found.
RESULTS
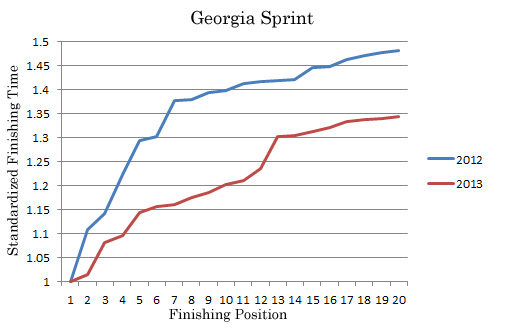
Georgia Sprint
Avg score for Top 20 in 2012 = 1.35
Avg score for Top 20 in 2013 = 1.21
Median score for Top 20 in 2012 = 1.41
Median score for Top 20 in 2013 = 1.21
20th place took 48.2% longer than first place in 2012
20th place took 34.3% longer than first place in 2013
Kruskal Wallis adjusted H = 11.34 and was statistically significant (P < .005)
The top 20 racers in 2013 had significantly faster finishing times as compared to the winner than the top 20 finishers in 2012.
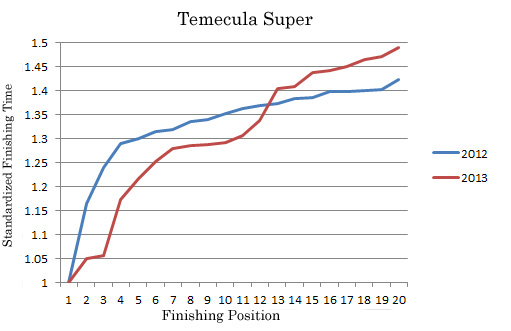
Temecula Super
Avg score for Top 20 in 2012 = 1.33
Avg score for Top 20 in 2013 = 1.30
Median score for Top 20 in 2012 = 1.36
Median score for Top 20 in 2013 = 1.30
20th place took 42.2% longer than first place in 2012
20th place took 48.9% longer than first place in 2013
Kruskal Wallis adjusted H = 0.031 and was not statistically significant (P > .05)
There was no statistically significant difference in finishing times of top 20 racers in 2013 as compared to the winner than in 2012.
Interestingly, standardized scores in positions 2 through 12 were faster in 2013 than in 2012, but positions 13-20 were slower.
Utah Beast
Avg score for Top 20 in 2012 = 1.35
Avg score for Top 20 in 2013 = 1.21
Median score for Top 20 in 2012 = 1.29
Median score for Top 20 in 2013 = 1.24
20th place took 38.7 % longer than first place in 2012
20th place took 30.6 % longer than first place in 2013
Kruskal Wallis adjusted H = 4.983 and was statistically significant (P < .05)
The top 20 racers in 2013 had significantly faster finishing times as compared to the winner than the top 20 in 2012.

DISCUSSION & CONCLUSION
Based on the results of this study of sample races, it would appear that competition in the men’s elite heat of Spartan Races was stronger in 2013 than in 2012. Results from the Sprint and the Beast showed that racers in the top 20 were statistically closer to first place (Hobie Call) in 2013 than in 2012. Results from the Temecula Super were somewhat surprising, but they still showed increased competition in the top 10. I expect the fierce competition to continue as more athletes discover the challenge of Spartan Race.
As mentioned earlier, there are limitations to this methodology. Although standardizing scores to one individual across all races helped control for some of the variables, it also had a limitation in that Hobie himself could have had a better or a poorer race based upon any number of factors (injury, training intensity, sleep the night before, etc.). Also, although there is no good way to control for this, the athletes participating in the races studied could have been an anomaly in that as a group they may have been faster or slower. Analyzing data from deeper into the pack past the Top 20 may have yielded different results and painted a different picture of competition levels. Also, the races studied were only approximately a year apart. Comparing results across a broader range of years would have provided a more robust data set. Finally, due to a number of reasons, only 3 races were studied. A compilation and study of an entire season would provide a better picture. Nonetheless, the results of the study do tend to confirm the assumption that competition is increasing among the Spartan Men’s elites. Studying the same question for the women’s heat would be interesting, but a different methodology will be needed as there has been no single consistent winner over the years as Hobie Call has been for the men.
Acknowledgements
I want to thank my faculty colleagues, Dr. Daniela Moga and Dr. Emily Brouwer, for listening to my methodology and providing me with additional tips into the data analysis. Also, thanks to Margaret Schlachter from Dirt In Your Skirt for providing a peer review of this post.
If you liked this (or even if you didn’t), you might consider following OnMyWayToSparta on Facebook or Twitter.
